The PACS Server
![]()
The PACS Server
![]()
The PACS server contains a configurable dashboard that includes user-to-user messaging, system statistics, report summaries, and shortcuts to custom worklists. To access the dashboard, select the icon ![]() at the top left of the screen. This page will display all the dashlets that were created in the Preferences/Dashboard Settings section.
at the top left of the screen. This page will display all the dashlets that were created in the Preferences/Dashboard Settings section.
See: Dashboard Settings
The image below displays all of the available dashlets.
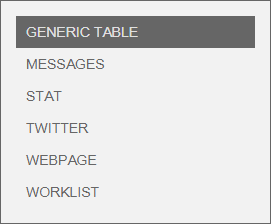
There are various options that appear when creating a dashlet:
![]() - Text field
- Text field
![]() - Dashlet size
- Dashlet size
 - Enable or disable
 - Dropdown
| Function | Description |
| Message expiration (days) | |
| History length | |
| Refresh time (s) | |
| Caption | text to be displayed |
| Visible | |
| Dashlet size |
| Function | Description |
| Select stat type |
| Function | Description |
| Twitter script code | |
| Caption | |
| Visible | |
| Dashlet size |
| Function | Description |
| URL to display | |
| Caption | |
| Visible | |
| Dashlet size |
| Function | Description |
| Caption | |
| Visible | |
| Dashlet size |