 PACS Desktop Viewer
PACS Desktop Viewer
The image fusion tool is a plug-in module for superimposing PET/CT and SPECT/CT structural and functional images into a single volume. Tools include orthogonal and volume oriented view controls, alpha blending, color spectrum application, and MIP view. The plug-in applies to studies whose largest, contiguous segment of images share complementary spatial resolution characteristics, meaning they were acquired on a single machine as part of a single procedure.
The image fusion plug-in module has the following workstation requirements:
Attempts to invoke the fusion plug-in module on a machine with insufficient resources may display one or more warnings or error messages. If so, the plug-in may appear to process the data correctly but performance may be poor and results cannot be guaranteed. Do not use the fusion plug-in until you are able to load the plug-in without receiving any popup notices.
When the viewer starts, it searches the server for the fusion plug-in license. If a valid license exists and the user account is configured to use the plug-in module, the viewer prompts the user to download and install it on the workstation. Once downloaded the plug-in installs automatically and is ready to use.
To invoke the fusion plug-in module:
The plug-in is ready to use when:
To fuse the loaded series with another, drag and drop another series into the image frame running the plug-in module. A progress bar pops up while the plug-in module processes the data. When finished, the progress bar disappears and all series loaded into the plug-in frame appear fused together on the screen.

The fusion plug-in consists of a viewing area and a toolbar (highlighted area).

The toolbar defaults to the right side of the image frame. It can be detached and floated anywhere in the image frame.
| Icon | Tool | Description |
|
4-up | Four image cells containing orthogonal and MIP views |
|
9-up | Nine image cells containing each series in orthogonal views |
|
Show/hide structural | Show/hide the structural image in individual cells |
|
Show/hide functional | Show/hide the functional image in individual cells |
|
Move structural | Manually line up the images by manipulating the structural image |
|
Move functional | Manually line up the images by manipulating the functional image |
|
Save image | Export the highlighted image |
|
Save series | Export a series of images from the highlighted cell |
|
Show/Hide hash marks | Toggle to show and hide the hash marks |
|
Show/hide SUV values | Toggle to show and hide the SUV overlay and SUV ROI annotation |
Display layouts
The two primary layouts display the images in different views:
| Layout | Description |
| 4-up | Displays the individual or fused series in all three orthogonal views, plus one MIP view. |
| 9-up | Consists of three rows showing the series in all three orthogonal views. The first row shows the structural image. The second row shows the functional image. The final row displays the fused images. |
MIP Image View
A MIP view of an individual or the fused image is available in 4-up display mode.
Image manipulation tools include scrolling, zooming, windowing/leveling, color palette adjustments, alpha blending, rotating and panning. By default, the fusion plug-in renders all loaded series. To display the image in a single series, load only one series into the plug-in frame, or deselect the Show Structural or Show Functional button from the toolbar.
Window/Level
To adjust the window and level settings for the displayed image:
Scrolling
To scroll through the image stack:
Zooming
To magnify the images:
Orbiting MIP View
To rotate the default MIP volume around a center point:
Cross Correlation
Cross correlation is the ability to identify the same point in all orthogonal images.
There are two modes:
After selecting the cursor mode:
Color Schemes
A number of predefined color schemes are available. The default scheme is red, and can be changed by the user. The other options include blue, red glow, blue glow, hot metal, ice water, rainbow, and none (grayscale).
To apply a selected color scheme:
Position the mouse over the fusion plug-in frame
Click the right mouse button
Select Color Scheme to display the submenu
Select the color scheme from the submenu
To adjust the palette range:
To change the default color scheme:
Alpha Blending
Alpha blending is combining the alpha layer with other layers in an image in order to show translucency. Alpha blending modes include Constant and Linear.
To select an alpha blending mode:
| Mode | Description |
| Constant | Alpha blending adjustments alter the alpha constant. The initial alpha constant is 0.5 |
| Linear | (Default) Alpha blending adjustments alter the alpha scaling factor. The initial alpha scaling factory is 2.0 |
| Reset | Reset the alpha constant and scaling factor to system defaults |
Constant alpha blending mode - the transparency is independent of the image’s color/intensity value
Linear alpha blending mode - the transparency is a linear function of the image’s windowed intensity
To alter the alpha constant or scaling factor:
Select the alpha blending mode (described above)
Press and hold down the CTRL key and the right mouse button
Drag the mouse forward or backward to increase or decrease the value
Manual Registration
The image series are automatically registered if they were acquired on the same device and are encoded with a shared frame of reference identifier. Other series can be manually registered.
To register an image series:
Annotations
The fusion plug-in module supports a number of annotations and overlays, including hash marks and SUV values.
Hash Marks
Orthogonal images in the fusion frame include hash lines of the interesting image planes that appear as cross hairs on the images. To show and hide the hash marks press the Show/Hide Hash Marks icon in the fusion toolbar.
SUV Values
When the functional image contains the standard uptake value (SUV) data, the information is displayed in the image cell by default. The uptake value for the point under the cursor is displayed. If SUV information is available, SUV values are displayed by default. To hide the SUV data overlay, press the Show/Hide SUV Values button in the fusion toolbar. SUV values are only displayed when specific values are present in the PET or SPECT series. Some values depend on the modality vendor and are generally required.
The value in parentheses is the DICOM tag value:
| SUV Values | DICOM Tag Value |
| Injection Dose | (0018,1074) |
| Injection date/time | (0018,1078) / (0018,1072) |
| Acquisition date/time | (0008,0022) / (0008,0032) |
| Half life | (0018,1075) |
| Patient weight | (0010,1030) |
SUV Regions of Interest
To display the maximum SUV value in a region of interest:
Position the cursor over the center of the SUV ROI sphere you want to draw
Press and hold down the Shift key and the left mouse button
Drag the mouse away from the center point for a circle to appear on the image
Release the mouse and keyboard once the circle defines the region
The maximum SUV value in the sphere will now appear on the image.
To remove or redefine an SUV ROI:
Position the cursor within the boundaries of the SUV ROI to highlight the annotation
Press the Delete key
Images created by the fusion module can be exported to the main viewer and sent to the archive for storage. Exported images can be attached to reports as key images on they are uploaded to the server. Uploading exported images requires Edit or Report permissions. Annotations applied to a fused image when it is exported remain on the image after exporting, but they cannot be modified outside the plug-in frame. To make adjustments to an annotation, reload the exported image into a fusion plug-in frame and edit it.
Exporting Fused Images
There are two ways to export a single fused image:
Exporting Fused Series
To export a series of fused images:
Select the fusion cell containing the images to export
Click the Export Series button
In the Export Options window, select the number of slices to include in the series plus the slice spacing (fused images) or incremental rotational angle (MIP)
Click OK
Fusion configuration allows you to define default color schemes, alpha blending mode and associated parameters, a slice space limit and some D3D compatibility parameters. Default color schemes can be different when applied to the fused image, the PET-only image and the MIP image. The fusion module configuration panel is available from the Image Fusion item under the Extensions menu at the top of the viewer. Click on Configure to pop up the configuration window.
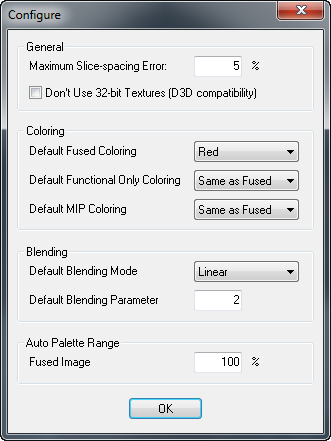
The four main areas of the configure pop-up are:
General
| Settings | Default | Description |
| Maximum slice spacing error | 5% | Defines the maximum spacing between slices accepted as belonging to the data volume. |
| Don’t use 32-bit textures | Disabled | If the data cannot be rendered in 16 bits, the data is expanded to 32 bits to preserve precision. Some D3D drivers and devices do not support this. Checking this box avoids this issue, but may result in rounding errors in the data. |
Coloring
| Settings | Default | Description |
Fused coloring |
Red | Default color scheme applied to fused images. |
Functional only coloring |
Same as Fused Coloring | Default color scheme applied to functional (PET) images when rendered non-fused |
MIP coloring |
Same as Fused Coloring | Default color scheme applied to MIP image |
Blending
| Settings | Default | Description |
| Blending mode | Linear |
Alpha blending mode which can be Linear or Constant |
| Blending parameter | Scaling factor / Constant - 2.0 / 0.5 | When mode is linear, this parameter is the alpha scaling factor. When mode is constant, this parameter is the alpha constant |
Auto Palette Range
| Settings | Default | Description |
| Fused image | 100% | Color saturation intensity applied to fused images. The default 100% is full intensity |
The following tables summarize the keyboard and mouse commands.
There are three modes available:
Normal mode
Magic X cursor mode
Manual registration mode
Normal Mode
| Key | Mouse | Action | Result |
| Right | Drag left/right | Window structural/primary image | |
| Right | Drag forward/backward | Level structural/primary image | |
| Shift | Right | Drag left/right | Change palette range width of functional image |
| Shift | Right | Drag forward/backward | Change palette range center of functional image |
| Middle | Scroll forward/backward | Scroll through images | |
| Middle | Drag forward/backward | Scroll through images | |
| Left+Right | Drag forward/backward | Resize image | |
| Left | Drag | Orbit MIP image | |
| Shift | Middle | Drag | Tilt the reconstructed planes |
| Ctrl | Left | Click or drag | Set cross correlation point |
| Ctrl | Right | Drag forward/backward | Adjust alpha blending setting |
| Shift | Left | Drag |
Define SUV ROI |
Magic X Cursor Mode
| Key | Mouse | Action | Result |
| Ctrl | Left | Click or drag | Apply Magic X |
Manual Registration Mode
| Key | Mouse | Action | Result |
| Shift | Left | Drag | Moves the structural image |
| Ctrl | Left | Drag | Moves the functional image |
| Shift | Right | Drag | Rotate the structural image |
| Ctrl | Right | Drag | Rotate the functional image |
| Shift | Left+Right | Drag | Resize the structural image |
| Shift | Left+Right | Drag | Resize the functional image |


