Image Annotations

Annotation Toolbar
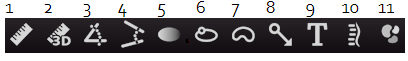
- Measure distance
- 3D measure distance
- Measure angle
- 3D measure angle
- Hounsfield value
- Region of interest
- Free form region of interest
- Pointer
- Text
- Spine labels
- Segmentation
The annotation tools are used to add graphics and measurements to images. To display the Annotations toolbar, select Annotation Tools from the Tools drop down. They can also be accessed in the second row of the toolbars or by utilizing the mouse controls. Once and annotation has been placed on the image, click on the Default Mode Cursor ![]()
These are the available Annotation Tools :
- Measure Distance
- 3D Measure Distance
- Measure Angle
- 3D Angle
- Hounsfield Value
- Region of Interest
- Free Region
- Pointer
- Text
- Spine Labeling
- Image segmentation
Measure Distance, 3D Measure Distance, Measure Angle, 3D Angle, Region of Interest and Free Region are all measurement annotations.
Modifying or Removing Annotations
To delete or modify an annotation:
-
Hover over annotation until icon appears and annotation is highlighted.
-
Right click on the image annotation
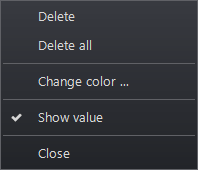
In the box that opens there are two options: Delete or Delete All. The other options allow modifications, including color and font changes, depending on the annotation.
Text Annotations
Use the Add Text  button, , to create or add text to an annotation to an image. A window appears with a field for entering the text string. This field is also pull-down list containing the previously entered annotation strings.
Hounsfield Value
The Hounsfield annotation tool creates a region of interest and calculates its average pixel value and the standard deviation on the distribution.
To obtain the Hounsfield Value of an area of an image:
-
Select the Hounsfield Value icon

-
Click on the region of interest
-
Drag on the mouse to encircle the area
-
Release the mouse button
The default region of interest drawn on the image is a true circle. When resizing the ROI, maintain a true circle by using the corner grab points.
If the image is a functional image (e.g., a PET image) and contains the data necessary to calculate standard uptake values (SUVs), the data reported in the annotation are the average, standard deviation and maximum SUV values for the ROI.
Pointer Annotation
The pointer graphic tool draws an arrow on the image.
To insert a pointer arrow:
- Select the Pointer icon

- Drag the mouse to adjust size of pointer
You can rotate the arrow by clicking on the end of it and dragging around.
Spine Labeling
The spine labeling cursor will label disc vertebrae and disk interspaces. These predefined labels are displayed in their corresponding location on images in all orthogonal planes.
To insert a spine label:
- Select the Spine Labeling icon

- Left click the icon next to each vertebrae or interspace to place a level annotation
- Select the next vertebrae or interspace to place the next level
Right clicking on the screen will reveal a spine label control panel. This box allows the user to reset the labeling for the vertebrae and the interspace and choose new levels.
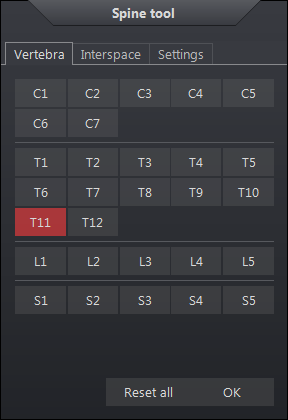
The settings tab contain these following options which are reset when the control panel is restarted:
| Spine Labeling Settings | Description |
|
Include L6 |
include L6 after L5 |
|
Reverse direction |
when enabled, labels progress in opposite direction |
|
Show Lines |
Display tether lines from the label to the focus point |
|
Hide Panel Automatically |
Hide the spine label control panel automatically after drawing the first spine label. |
|
Axial, Coronal, Sagittal |
Spine labels are displayed on all images in the relative plane. Applies at the time the image is annotated. |
|
Applied Plane |
Display the labels on the images in the same plane as the one used to annotate the spine. |
In order to place specified labels in the orthogonal images, the graphic must intersect the image within the defined distance from the focus point which will then appear in the intersecting plane. The spine labels appear in all orthogonal images automatically. If the frame of reference is not predefined, the images would have to be labeled individually. If the focus point falls outside the distance specified, no label appears.
To remove a single label:
-
Select annotation cursor mode
-
Right-click on the label
-
Select Delete
Select Delete All from the same menu to remove the spine labels and all other annotations. To remove all spine labels, including all the labels in intersecting planes, and leave other annotations, click Reset Spine Label on the spine label popup window.
See also: Annotation Toolbar
Image Segmentation
The segmentation tool highlights selected regions on an image. Multiple segmentation layers are supported. Segmentation data can originate in third party devices and get rendered in the viewer if the segmentation information is sent to the system. Users can draw custom segmentation regions on images as well. Users can modify custom and third party segmentation layers using the viewer's segmentation annotation tools.
To render an existing segmentation overlay on an image:
- If segmentations exist for an image, the Overlay Renderers tool,
 , appears in the top, left corner of the image frame. Click it to expand the list of available segmentation overlays.
 - From the list,
- Select all the segmentation overlays to apply to the images.
- Note: You can display multiple segmentation overlays but only one heat map overlay can be displayed at a time.
- Select No Renderer to hide the segmentation overlay.
- Select Apply to All to apply the segmentation overlay to all image frame. Clear the setting to apply it to the selected image frame only.
- Select all the segmentation overlays to apply to the images.
To create a segmentation overlay:
- Select the Edit Segmentation annotation tool,
 .
. - Position the mouse over an image frame. The cursor mode changes to Add Segmentation,
 . Click anywhere on the image frame to pop up the Add Segmentation Overlay panel.
 - Enter a segmentation name in the Name field and click the Add button.
- Select the new segmentation in the list.
- Click OK.
To customize a segmentation overlay:
- Select the Segmentation editor tool,
 .
.
- If multiple segmentation overlays exist, select the one you want to edit from the list.
- In the segmentation editor panel, adjust the overlay's values. (See table below.)
- Settings take effect immediately. To close the panel, click the close button, X, in the top corner of the panel.
The segmentation configuration setting and tool settings are as follows:
| Setting | Description |
| Opacity | The opacity of the selected segmentation layer. Minimum value is 30%. Maximum value is 100%, meaning the layer is not transparent. |
| Segmentation draw mode |
Segmentation draw mode. Options include: Fill: Segment regions are fully filled in Contour: Segment region outline only |
| Segmentation layer list |
List of available segment layers. Name: Layer name Status: Visible state of the layer Color: Segment region color |
| Show/Hide | Show or hide the selected segmentation layer |
| Show all | Make all segmentation layers visible |
| Hide all | Hide all segmentation layers |
| Add |
Add a new segmentation layer. A configuration panel appears prompting for the following information: Name: Name of the segmentation layer Description: Optional text description of the segmentation layer Color: Drawing color for the segmentation layer Level: Segmentation layer number |
| Delete |
Delete the selected segmentation layer |
| Edit | Edit the selected segmentation layer |
| Mask | An available segmentation used to determine whether a given voxel in the selected segmentation is visible or not. By default, no mask is assigned. |
| Undo/Redo | Undo or reapply the last change to the segmentation region. |
| Overwrite segmentations | If allowed, the selected segmentation values can overwrite other segmentation values. If not allowed, the segmentation drawing tool will not overwrite other segmentation values applied to the image. |
| Size of drawing tool | Defines the diameter of the segmentation drawing tool. |
| Size of magic region | Defines the diameter of the bounding region surrounding the drawing tool. Within this region, the drawing tool attempts to identify the region being draw and refrains from drawing over the image that is outside the anatomical region. |
To draw a segmentation region on an image:
- Select the Overlay Renderers tool, . If multiple segmentation overlays exist, select the one you want to apply from the list.
- Select the Segmentation editor tool, . In the configuration panel, select the segmentation layer you intend to draw.
- Position the cursor over the region of the image you intend to highlight. Click and drag the cursor to fill in the region.