Database
Summary
This enhancement to Database updates the database performance metrics being gathered and introduces three new Managements Reports.
Feature Description
Three new reports have been added to the Management Reports/Maintenance folder:
1. RIS Database Performance Stats
2. RIS Screen Load Times
3. RIS Screen Save Times
Additionally, metrics are now available to identify which service calls are keeping the server busy.
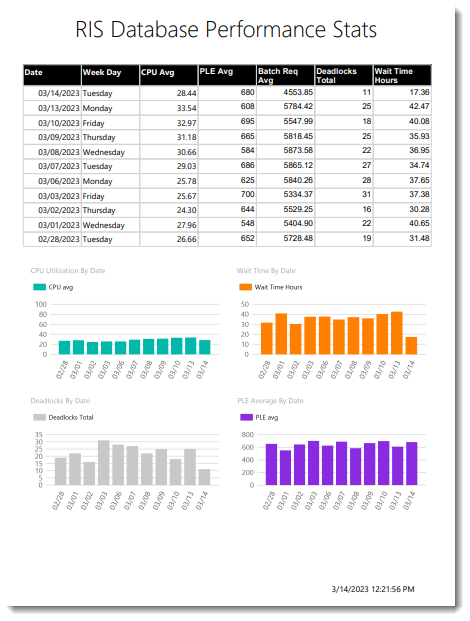
RIS Database Performance Stats
This management report shows selected information from the DB section of ris_diag.c_showoveralstats:
Sample report.
Note that Ris_diag.c_showoveralstats has been updated to take an optional parameter, resultFilter to limit the result sets.
Prior to this change, the stored procedure returned 4 sections: a system summary, a database statistics section, a section on general ris statistics.
With this change, the resultFilter parameter accepts the values All, Summary, DB, and RIS. If a value isn’t specified, all sections will be returned. If Summary, DB, or RIS is specified only that section is returned.
RIS Screen Load & Save Times
Management Reports were created to show the screen load and screen save times.
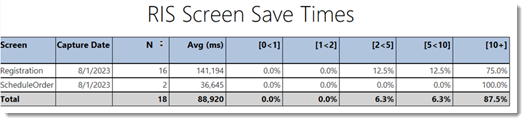
Sample report. RIS Screen Load Times provides a similar view.
Each night, screen load data and other performance data is moved into an aggregate type table that is maintained for a longer period of time. Ris_diag.c_CapureRISEventData runs each night and gathers performance information and moves it to ris_diag.c_ris_event_data.
Previously all screen loads were being aggregated together. These are now grouped by screen name. As this increases the number of rows being saved, the reporting interval has been reduced from 5 minutes to 15 minutes.
Top Database Calls Metrics
Additionally, a new database stored procedure ris_diag.c_ShowTopCalls was added to show which service calls are consuming the most CPU time. This data is useful for comparing one customer’s database to another, or for identifying performance tuning opportunities.
For example, the following sample output shows GetEligibilityByKeys consumed 2800 minutes of server time in a day, while the next highest service call, GetPatientBalance, consumed 1500 minutes:
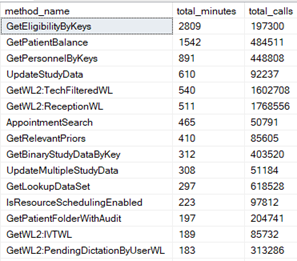
Sample report.
Configuration Instructions
No System Administrator actions are necessary to enable this feature, however Service Team assistance is required for some actions.